Riven as Series of Cards
The original Riven (1997), the sequel to Myst, was developed for the Mohawk engine, resulting in game files stored in a proprietary format. Myst for Mac also used a proprietary format: HyperCard. The success of the Myst Graph project relied on a readily available library (stackimport; more recently: mystextract) that simplified parsing the original game files. This can be explained by the fact that HyperCard remains relatively popular in the retro computing community. By contrast, while the Mohawk format is partially documented and supported by ScummVM, I found no easy way to navigate Riven’s files as individual cards.
To address this lack of tooling, I am currently developing an application to generate a Riven navigator (just nicknamed “Navigator” in this article) that decomposes the game world into its constituent cards. Each card will contain metadata (card name, etc.), its embedded images, the location of its “hotspots” (that is: the clickable areas within the game), and their associated scripts.
Decoding these scripts is still ongoing work. Therefore, a full analysis of relationships between cards is not yet possible. I am keeping the Navigator closed source during development but will open source it once it is complete.
But even without full script analysis capability, some initial observations are worth sharing.
First Insights
Unlike Myst, where each card typically embeds a single view (though some cards include partial images for visual effects), Riven allows a card to reference multiple images. For example, consider this card from Temple Island, embedding 20 images (If you squint, you can spot very subtle differences between these images...):

This means that in Riven, a card generally represents a location, except for special cards like the menu or those representing books. In contrast, a Myst card typically represents a single view. Furthermore, a location in Riven can have different appearances depending on gamer actions: reaching card X might show a closed door, while pulling a lever (without changing locations) could open it. Both views are handled by the same Riven card (X), whereas Myst would require two separate cards: card X for the “door-closed” view and card Y for the “door-open” view.
Based on this distinction, we can start by identifying the cards with the most images associated with them. For consistency with the Myst Graph project, I will use the same naming convention in this section: “{stack name}:{card number}”.
Cards With the Most Images
Here are the cards with the most images, listed in descending order. (To keep this article concise, I am limiting myself to the first five).
Menu:6 – 51 images
This card, belonging to the stack that also contains the menu and books (“aspit”), holds the pages of Catherine’s journal, requiring 51 images.
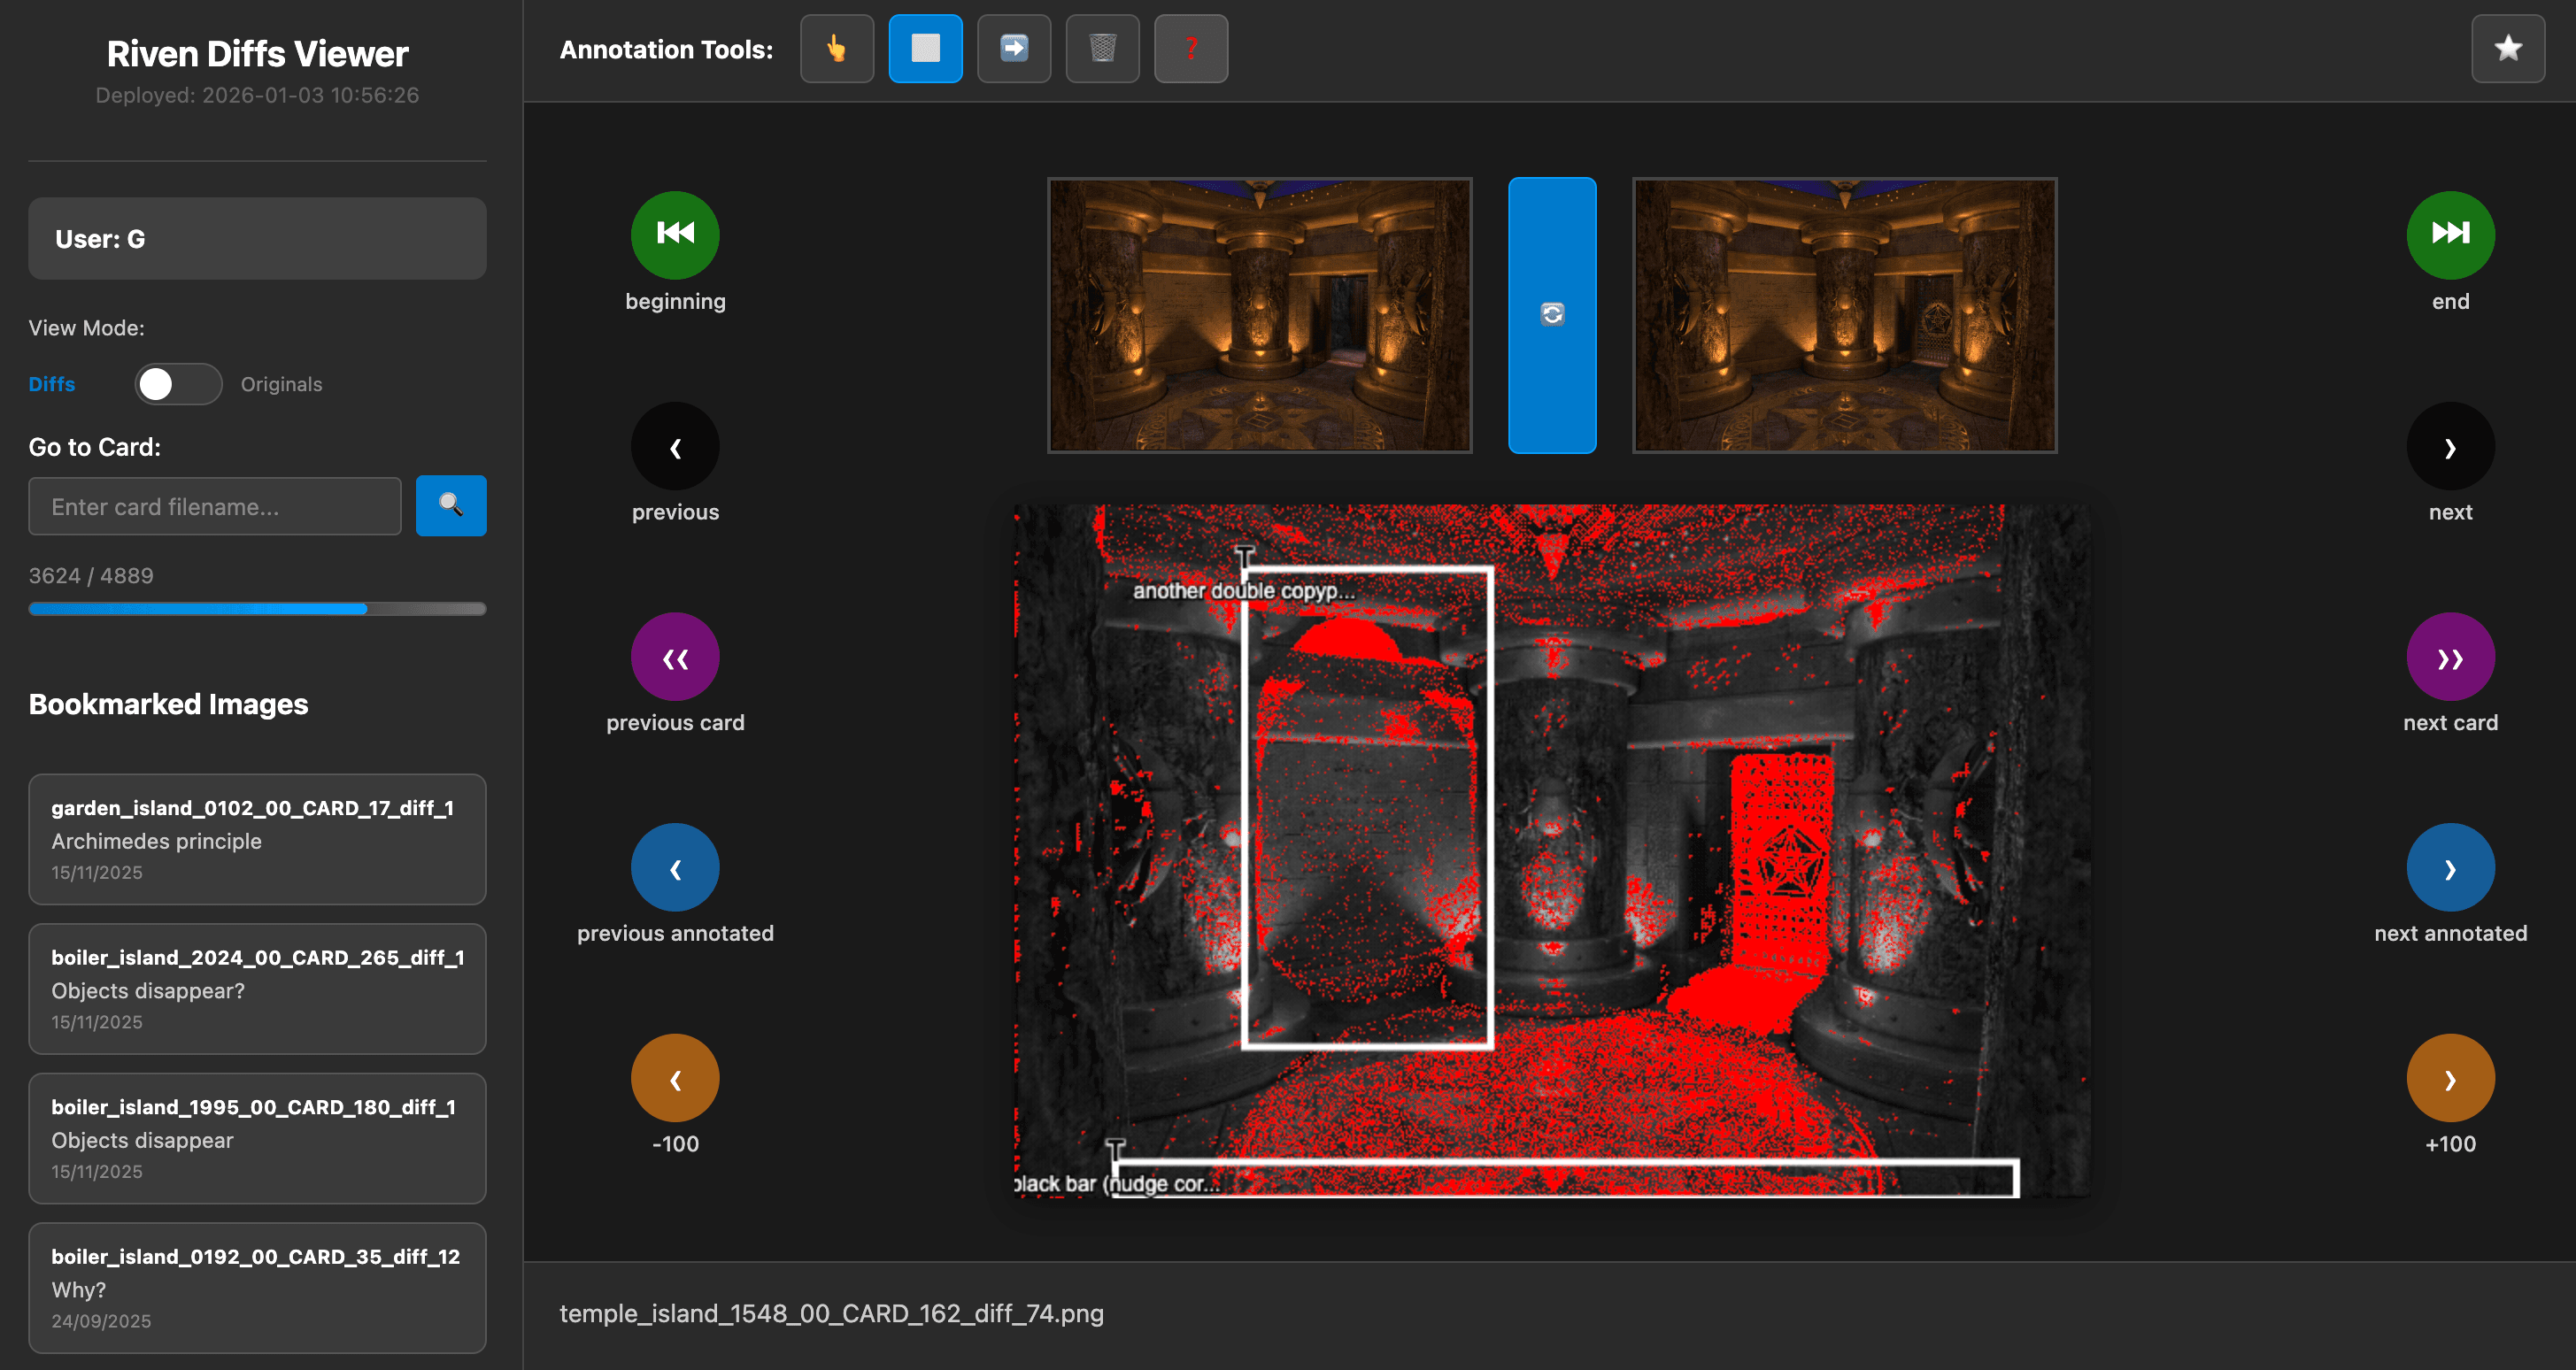
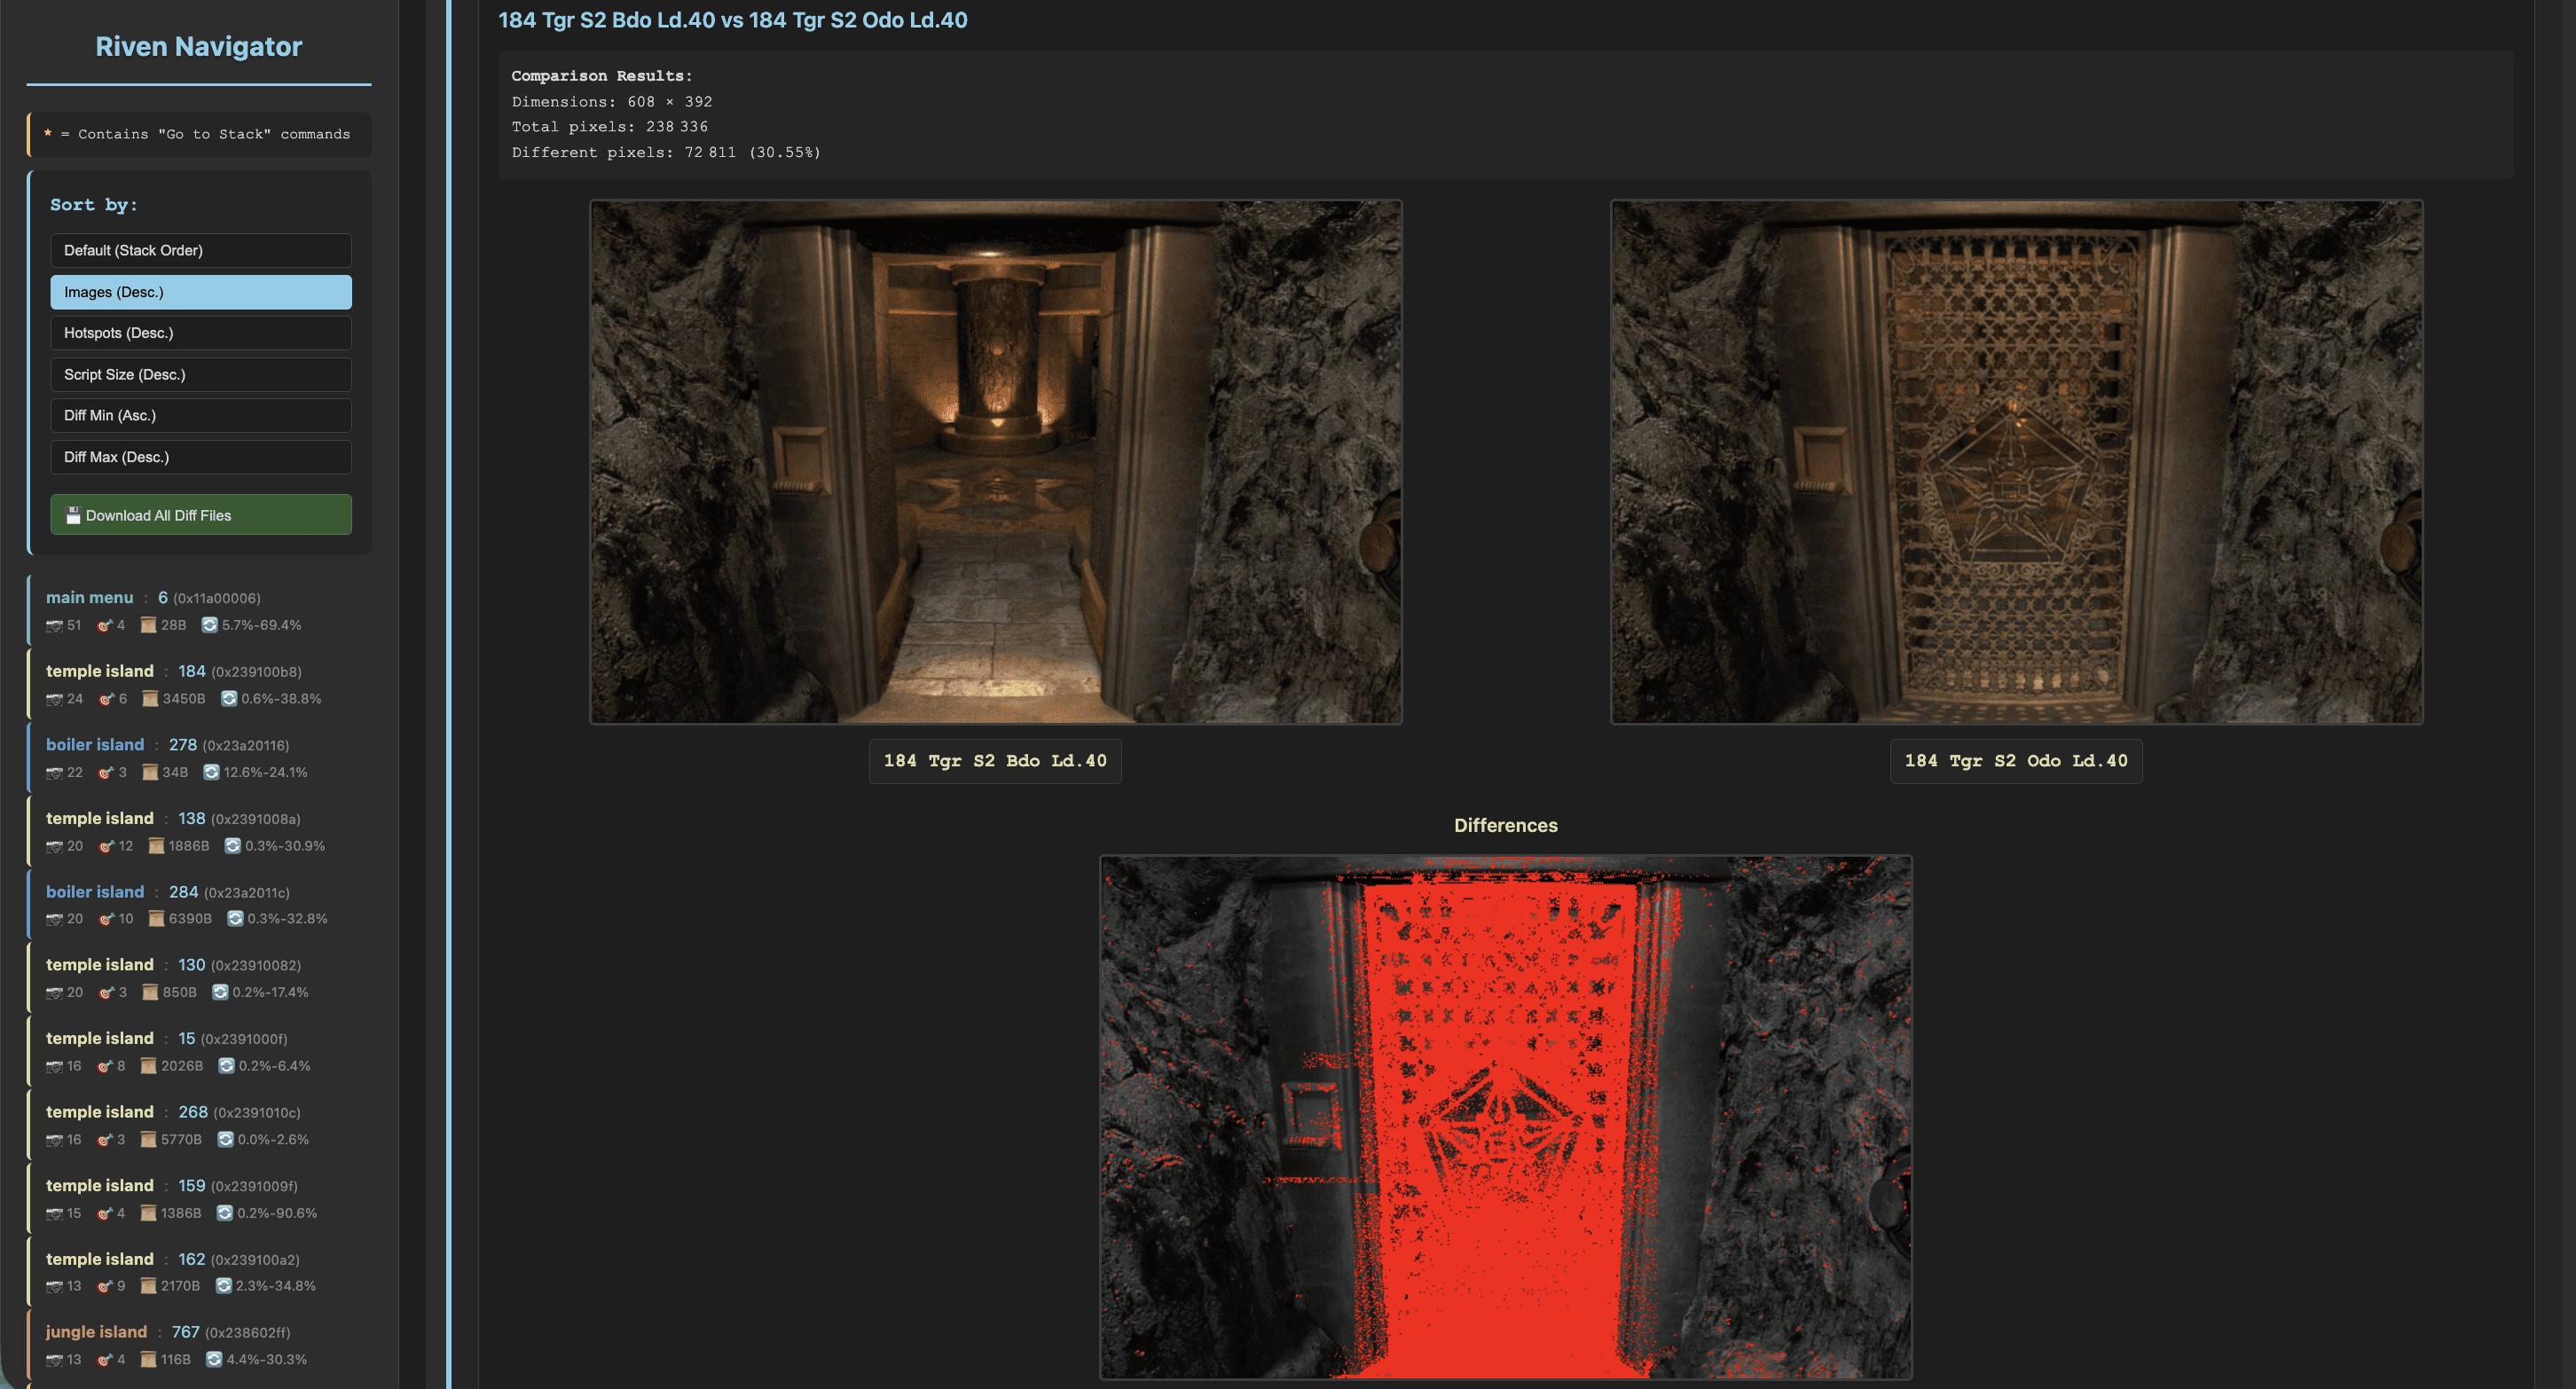
Temple:184 – 24 images
The entrance to the Temple, with its rotating doors, requires no fewer than 24 images to represent all unique views resulting from different combinations of actions: wall, screen door opened, lever up; wall, screen door closed, lever down; room visible (no wall), screen door opened, lever up; room visible, screen door opened, lever down; room visible, screen door closed, lever up; etc.

In this example, the image on the right (184 Tgr S1 Bdc Ld. 40) shows the screen door closed in front of the wall, while the image on the left (184 Tgr S1 Ido Ld. 40) represents it open, also in front of the wall. The middle image highlights the differences between these two views, with red pixels indicating exactly where the images differ. This diff image is generated by the navigator, that automatically compares all unique pairs of images within a single card. This technique allows for the detection of even subtle variations. For instance, while the following images may seem identical at first glance, there is a slight difference in scene lighting:

Further subtle differences are shown below.
Boiler:278 – 22 images
This card contains Gehn’s journal from his lab on Boiler Island, each page requiring an image (similarly to Catherine’s journal), for a total of 22 images.
Temple:130 and Temple:138 – 20 images each
The telescope views, shown above, result from the combination of multiple factors (bridge up/down; manhole close/open; reflection of the light on the dome; lever up/down; telescope up/down; etc.).
Cards With the Most Hotspots
As stated above, Riven cards contain hotspots. They represent areas of images with which the gamer can interact with, either to perform actions from a given location (e.g., pull a lever, push a button), or go to another card (change view, move). The Riven Navigator materializes these areas with rectangles. When clicking a hotspot rectangle, the Navigator shows the script associated with that hotspot, facilitating the analysis of each action.
Here is an example of an image with typical hotspots (usually, there are hotspots on the left and right so that the gamer can turn their head):

The spinning book domes require many hotspots, as each segment of the slider is a hotspot.
Prison:42 – 33 hotspots
The dome on Prison Island requires 33 hotspots.

Temple:392, Jungle:338 – 31 hotspots each
The domes on Temple Island and on Jungle Island require 31 hotspots.


Boiler:443, Garden:173 – 30 hotspots
The domes on Boiler Island and Garden Island require 30 hotspots.


Gehn:85 – 25 hotspots

This one is interesting. Card Gehn:85 depicts the top of Gehn’s nightstand. From here, there are only three interactive options: zoom out (hotspot 1), open his journal (hotspots 2 to 24), or examine the metal device (hotspot 25; go to new card). The unusually high number of hotspots for the journal is a consequence of the Mohawk engine’s hotspot implementation. Mohawk only supports defining non-rotated rectangular hotspots. To achieve full coverage of the slanted journal cover, the developers were forced to approximate its shape with a series of smaller, overlapping hotspots, each linked to the same action.

Card Boiler:480 employs a similar technique but works in reverse to disable interactive areas. For example, hotspot 4 takes the gamer to the boiler, but it is partially obscured by rocks in the image. To prevent accidental clicks on those non-interactive parts, hotspots 5 and 6 are used: they essentially do nothing (NOPs) and cover the area of hotspot 4 that overlaps with the rock formations. The same approach is applied to the left side of the boiler.
Diffs: Images with Minimal Variations (Close-to-Identical)
Riven’s development was remarkably meticulous, and a fascinating way to appreciate that detail is by examining pairs of near-identical images within the game files. These “diffs” (images with only slight variations) reveal how systematically the 3D scenes were rendered and updated to reflect even the smallest changes in gameplay state. Often, these differences are so subtle they are almost invisible without a direct comparison.
Here are a few examples showcasing this impressive attention to detail. (To detect them, focus on the red pixels in the middle gray image).
Boiler:477 – 9 pixels
This example perfectly illustrates Riven’s systematic rendering approach. The images depict the boiler from a distance, focusing on its front gauge (or level indicator) positioned just right of the door. One image shows the gauge empty, while the other displays it full. The change is incredibly subtle, almost imperceptible to the naked eye, with only 9 differing pixels.

Animated comparison (GIF):

(In this high-speed animated GIF above, we can see with difficulty that the gauge changes.)
Boiler:30 – 12 pixels
Looking at Gehn’s Lab from the boiler reveals another small but significant variation. This diff highlights whether the ladder hatch is open or closed. It is a logical update reflecting gamer interaction, rendered with impressive precision.

Animated comparison (GIF):

Boiler:478 – 26 pixels
Boiler Island seems to be a hotspot (ah!) for these nuanced changes. Like Boiler:477, this image focuses on the boiler’s front gauge at a distance. The game logically tracks whether it is full or empty, and this is reflected in the rendering despite the difficulty of visually discerning the difference.

Animated comparison (GIF):

Temple:447 – 46 pixels
Inside the dome, a subtle change occurs depending on whether the bridge has been set. This variation is particularly challenging to spot due to the dark environment.

Animated comparison (GIF):

Boiler:12 – 50 pixels
And back to the boiler! Once again, we see a variation focused on the front gauge.

Animated comparison (GIF):

Diffs: Images with Substantial Variations
The pairs of images with the most contrast are all related to Jungle Island.
Jungle:535, Jungle:536, Jungle:539 – 100% difference
The submarine provides high contrast in 3 locations, where its dark hull stands out sharply against the blue sky and white clouds.


Jungle:530 – 99.99%
In one location, the contrast between the submarine and the sky is slightly reduced (99.99%) because some parts of the submarine’s hull match the colors of the landscape on the right.

Jungle:154 – 99.96%
This one is particularly interesting, as it is an easter egg (the “walk in the sky”). Again, a contrast against the sky, except that the sky is below us!

Diffs: Subtle Variations
While reviewing recent diffs, I have been catching some interesting, minor variations. I have not conducted a systematic study yet but wanted to share these observations and solicit the thoughts of the readers on their potential meaning.
Lighting Details
Shadows and light cast by external elements have a minor impact on the lighting on the doors of Temple:308 and Temple:543. It is a second-order effect, but noticeable, nonetheless.


This effect is also visible in Temple:247:

Maglev
Looking at Boiler:200 and Boiler:230, the Maglev has a faint presence. In one location, it is theoretically visible through the stairs, even if not directly seen. In the other, while partially visible on the right side of the frame, there is an intriguing effect on how the stair framework supports (the metal tubes) are rendered: they appear brighter when the Maglev is present.


Animated comparisons (GIFs):


Development Artifacts?
I have also spotted what seem to be “patches” in some comparisons, like this one in Jungle:194 within the rebels’ tunnel (a rectangular shape). These patches look as though images have been layered on top of the original view rather than being fully re-rendered.

In Temple:404, I am still trying to understand the nature of that slanted line; smaller patches are also present there.

(Edit 09/20/25) On the Myst, Obduction, and Beyond Discord server, user “Twitch” (drrg) offers a credible theory: the slanted line could be a narrow beam of light filtering down from above while the elevator is in its lowered position.
You can look up the elevator shaft only when the elevator is down to see this. But when the elevator is up there's no gap.
. . . I also wonder why the button looks different between these two shots considering that the button doesn't ever permanently change states.
. . . I think the button is straight up in the wrong place in one of these renders.

Cards With the Longest Scripts
In this section, I'm sharing only the script sizes rather than their content, since I do not currently have a robust way to decode the binary data into readable scripts.
Boiler:284 – 6,390B
This location contains complex logic (complexity here correlates with data size, which holds true in this specific context). It contains 6,390 bytes of script.

Temple:268 – 5,770B

Temple:443 – 3,666B

Temple:184 – 3,450B

Jungle:327 – 3,304B

Prison:32 – 1,072B
Generally, there is a correlation between the number of images per card and script complexity. However, Prison:32 stands out as an exception; it contains just over 1KB of data but only includes one image. I do not recall ever encountering this situation in-game (that is: within the closed elevator).

Conclusion
This concludes my initial observations made possible by the Riven Navigator. I have not conducted a systematic analysis yet; these findings represent the most readily apparent patterns. My next step is to properly decode the scripts, with the goal of understanding the relationship between cards and potentially even viewing them as interconnected nodes.